Menu
close
Modern self service reporting for your line of business data and processes. Point and click insight you can share with everyone.
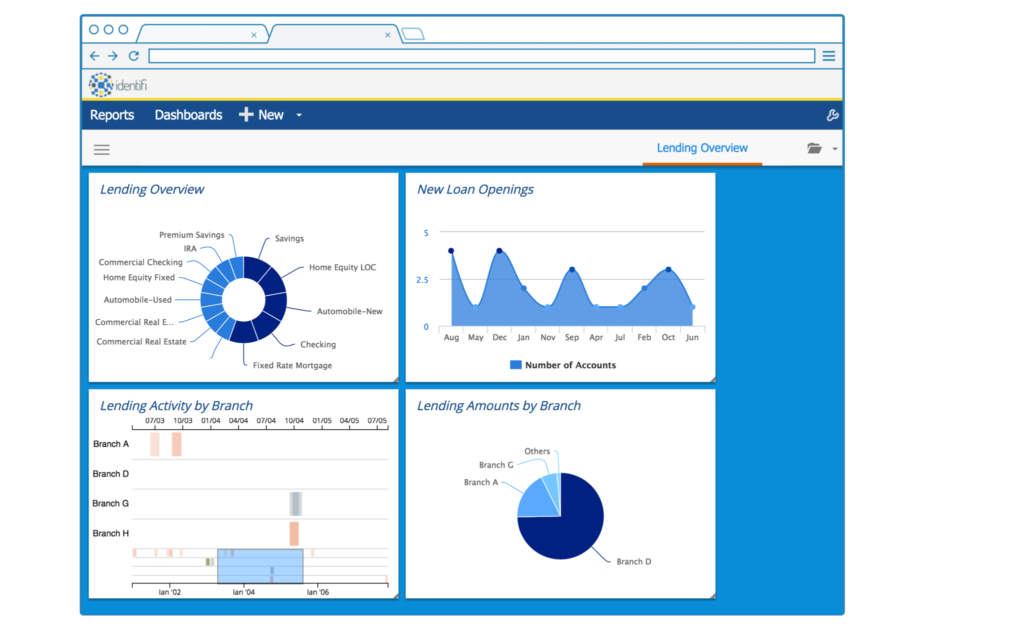
Pull it all together with smart dashboards.
Dashboards are a dynamic and interactive tool for viewing critical information from multiple sources in a single view. Users can hover over a report to get details, or drill down into it for greater insight. Create and customize your own BI dashboards, then use them to print, save, share and send reports. Security options let you decide who can view or make edits.
Get answers on demand.
Instant reports allows you to quickly answer questions using the easy-to-learn Instant Report Designer. Discover new data insights even if you don’t understand SQL. Instant preview makes it easy to see how well your processes are performing (or not!). Combine data from different sources, add totals, and use criteria to filter data. Quickly develop charts and graphs with no coding.
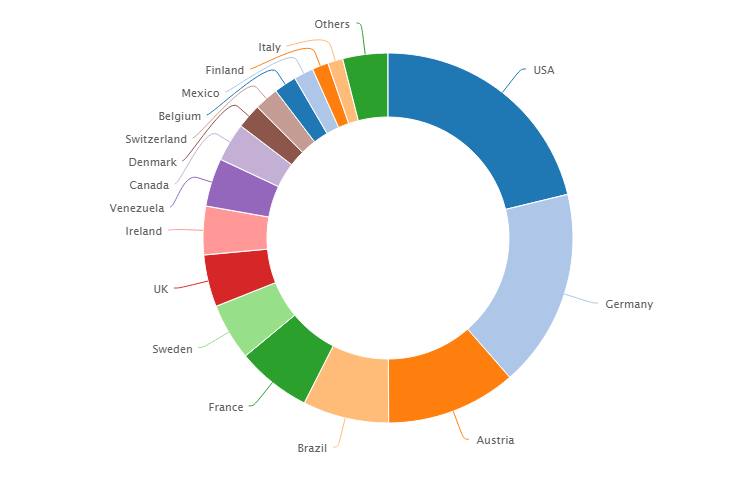
Let the data tell the story, beautifully
Identifi Analytics allows you to visualize your business data with stunning charts and graphs that tell the story at a glance. Personalize report gauges and maps to that make sense for your data. Dive deeper into any visualization with unlimited drill drown levels. Use over a dozen different ways to visually communicate your data.
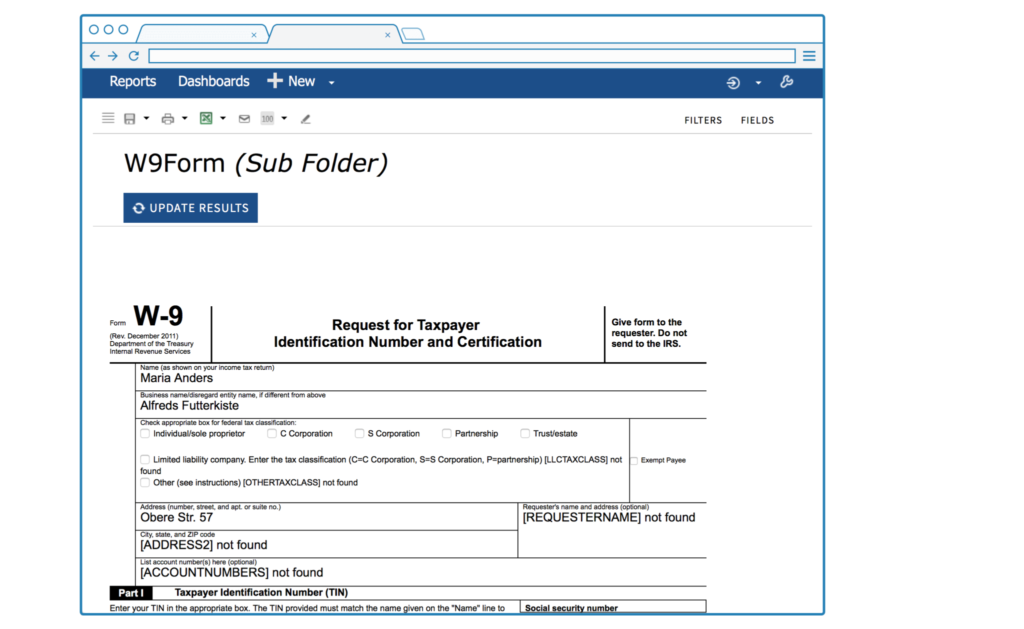
Recreate legacy reports and documents with ease.
Create custom layout forms with Report Documents. Use self-service content customization with a browser-based, WYSIWYG designer to recreate legacy reports and forms quickly and easily. Create pixel perfect representations of government, corporate, or partner documents. Merge data from analytics directly into the report document for mass document creation.
Transition to modern self-service reporting and analytics.
Create reports and dashboards point and click. No scripts and no wizards. Drag and drop fields together to create reports in seconds. Extract key data and export it to Excel, Word, or CSV to use on your desktop with other applications. Self-service provides real-time analytics for everyone, everywhere. From a critical boardroom presentation to a quick check via cell phone, create and immediately view reports without relying on IT.
